
Tracking API usage can be quite a technical challenge due to the high speed and volume of requests. Yet, having accurate analytics for your API is crucial, especially if you rely on that to invoice your customers. It is possible to be both fast and accurate with a time-series database called TimescaleDB. This is actually the solution we implemented behind NLP Cloud.
What Is API Analytics And Why Is It Hard?
API analytics is about retrieving various metrics related to the usage of your API.
For example, behind the NLP Cloud API we want to know the following things:
- How many requests were made during the last minute, the last hour, the last day, the last month, and the last year
- How many requests were made per API endpoint, and per user
- How many words were generated by our text generation NLP models (like GPT-J)
- How many characters were used by our multilingual NLP add-on
All these metrics are important in order to better understand how our API is used by our customers. Without such data, we’re unable to know which NLP models are the most used, who are our more important customers, etc.
But even more importantly, some of these metrics are used for invoicing! For example, customers who subscribed to a “pay-as-you-go” plan, are charged based on the number of words they generated with our API.
A very high volume of data is going through our API gateway, which is a challenge in terms of performance. It is very easy to either slow down the API, or lose some data.
So this is crucial that such an API analytics system is both fast and reliable.
TimescaleDB To The Rescue
TimescaleDB is a PostgreSQL database that has been optimized for time-series.

Basically, Timescale is optimized for a high volume of atomic writes. It is perfect for a use case where you write tons of data on a very regular basis, but almost never alter this data, and only read the data occasionally.
Timescale comes with interesting tools that make time-series easier. For example, they have so-called “continuous aggregates”. Such aggregates are a way to automatically “down-sample” your data on a regular basis. Down-sampling means that you remove old data after some time, and only keep some aggregates of this data (based on sums, counts, averages, etc.). It it crucial for 2 reasons:
- Time-series can grow very quickly, so it is a very good way to save some disk space
- Reading from a table stuffed with data can be painfully slow. It is much easier to read the data from an aggregated table that contains less data.
As opposed to other solutions like InfluxDB, TimescaleDB is a pure SQL solution, so the learning curve is quite low, and it will make the integration much easier. For example at NLP Cloud we’re interfacing with TimescaleDB in both Python and Go applications and we’re able to use our usual PostgreSQL libraries.
Installation
You can install TimescaleDB as a system package, but it’s simpler to install it as a Docker container.
First pull the Docker image:
docker pull timescale/timescaledb:latest-pg14
Then start your container and pass a password for your DB:
docker run -d --name timescaledb -p 5432:5432 -e POSTGRES_PASSWORD=password timescale/timescaledb:latest-pg14
Data Structure In TimescaleDB
In this example, we want to store API requests. We want each request to contain the following:
- The time of the request
- The id of the user who made the request
- The API endpoint used during the request
The first time your launch TimescaleDB, you will need to create several things.
First init the TimescaleDB extension.
CREATE EXTENSION IF NOT EXISTS timescaledb;
Create the table that will store API requests, like we would do in any PostgreSQL DB:
CREATE TABLE IF NOT EXISTS api_calls (
  time TIMESTAMPTZ NOT NULL,
  user_id TEXT NOT NULL,
  endpoint TEXT NOT NULL
);
Then we create a so-called “hypertable” out of it:
SELECT create_hypertable('api_calls', 'time', if_not_exists => TRUE);
Hypertables are the heart of TimescaleDB. They automatically add many smart things in order to manage your data efficiently.
We now create a specific view out of your api_calls table called api_calls_per_hour. It is a view that will store aggregated data coming from api_calls. Every hour, the number of API requests in api_calls will be counted and put in api_calls_per_hour. The view will be much faster to query since it contains much less data than the initial api_calls table.
CREATE MATERIALIZED VIEW IF NOT EXISTS api_calls_per_hour
WITH (timescaledb.continuous) AS
SELECT time_bucket('1 hour', time) as bucket, user_id, endpoint,
COUNT(time)
FROM api_calls
GROUP BY bucket, user_id, endpoint;
Last of all, we create a continuous aggregate policy and a retention policy. Both will be managed by background workers. Most of the time everything works fine, but it you start having a lot of policies you might run out of background workers and you will see some error messages in your logs. In that case, the trick is to increase your number of background workers in /var/lib/postgresql/data/postgresql.conf.
The continuous aggregate policy will take care of regularly down-sampling the data from api_calls and putting it in api_calls_per_hour. The retention policy will take care of deleting old data from api_calls so you will never run out of disk space:
SELECT add_continuous_aggregate_policy('api_calls_per_hour',
  start_offset => INTERVAL '1 day',
  end_offset => INTERVAL '1 hour',
  schedule_interval => INTERVAL '1 minute',
  if_not_exists => TRUE);

SELECT add_retention_policy('api_calls', INTERVAL '90 days', if_not_exists => TRUE);
As you can see it was not too complex.
Inserting Data
In your application, you can now connect to your Timescale DB and insert requests.
For example, here is how you would do it in Python:
import psycopg2

conn = psycopg2.connect(
  "host=timescaledb dbname={} user={} password={}".format("name", "user", "password"))
cur = conn.cursor()
cur.execute("INSERT INTO api_calls (time, user_id, endpoint) VALUES (%s, %s, %s)",
  (datetime.now(), "1584586", "/v1/gpu/bart-large-cnn/summarization"))
conn.commit()
cur.close()
conn.close()
And now in Go:
import (
  "github.com/jackc/pgx/v4"
  "github.com/jackc/pgx/v4/pgxpool"
)

func main(){
timescaledbURL := fmt.Sprintf("postgres://%s:%s@timescaledb:5432/%s", "user", "password", "name")
timescaledbDatabase, err := pgxpool.Connect(context.Background(), timescaledbURL)
if err != nil {
  log.Fatalf("Cannot connect to TimescaleDB database: %v. Stopping here.", err)
}

query := `INSERT into api_calls (time, user_id, endpoint) VALUES ($1, $2, $3)`
ctx, cancel := context.WithTimeout(context.Background(), 5*time.Second)
  defer cancel()

  _, err := timescaledbDatabase.Exec(ctx, query, time.Now(), "1584586", "/v1/gpu/bart-large-cnn/summarization")
  if err != nil {
    log.Printf("Cannot insert metric in TimescaleDB: %v", err)
  }
}
Important point: you most likely don’t want to slow down user API requests because of potentially slow processing on the TimescaleDB side. The solution is to insert your data asynchronously, so the user API response returns even if the data is not inserted in your DB yet. But this is beyond the scope of this article.
In order to improve the throughput, you can also insert several API requests all at once. The idea is that you would first need to cache some requests in memory, and then save many of them in DB at once after some time.
Data Visualization
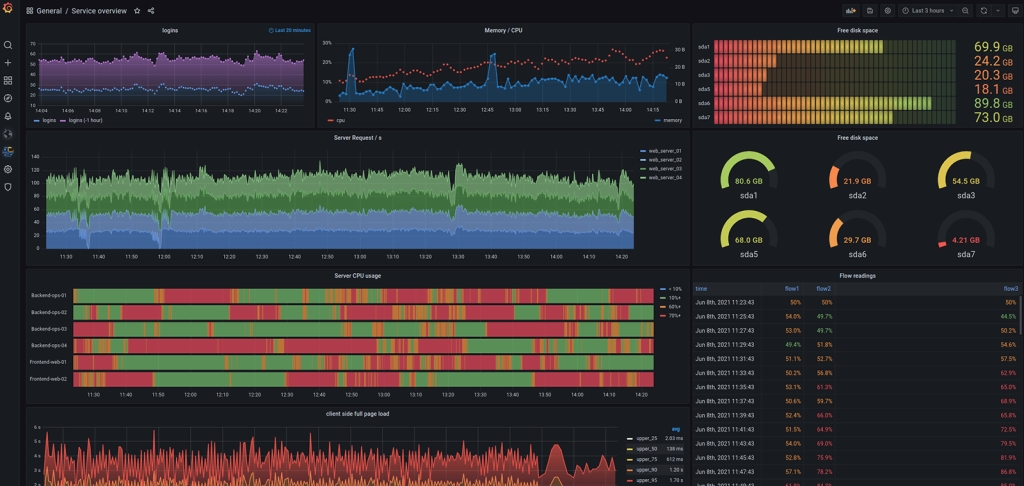
Many data visualization tools exist. I like Grafana because it is easy to plug it into TimescaleDB, and the chart capabilities are countless.
Here is a nice tutorial about how to set up TimescaleDB with Grafana: see it here.
Conclusion
TimescaleDB is a powerful tool for time-series, and this is a great solution if you want to properly analyze your API usage.
As you can see, setting up and using TimescaleDB is quite easy. Careful though: TimescaleDB can quickly use a lot of RAM, so make sure to keep that in mind before provisioning your server instance.
If you have questions please don’t hesitate to ask!