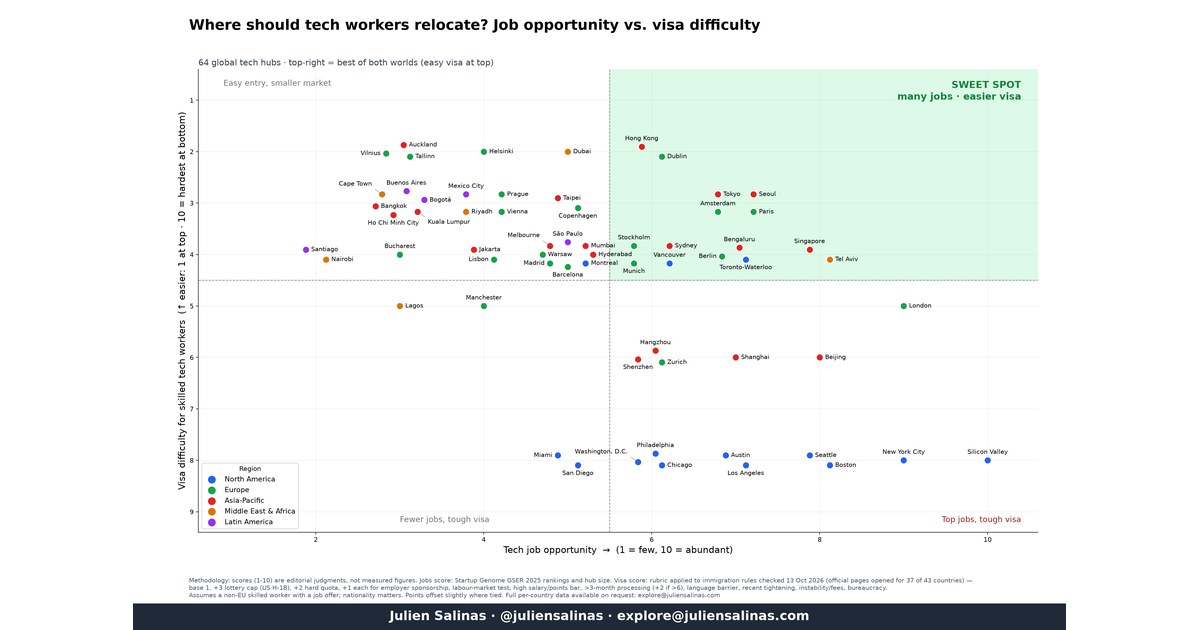

More tech workers are open to moving abroad for work than a few years ago. But “where is the job market good?” and “where can I actually get a visa?” are two different questions. I put both on one chart for 64 tech hubs.
Why this matters
A few data points I checked:
- In the 2025 CERC/Ipsos Global Mobility Survey of 10,574 workers across 19 countries, “almost half (49%) of employees say they would consider relocating internationally for work; a notable increase compared to 2017, when 46% would consider the same” (Ipsos). The sponsor report frames this as relocation “for up to two years” and lists information technology (58%) as the second most open sector, behind utilities (59%) (CERC/WFPMA sponsor report).
- The most famous tech visa is also a lottery. For the US H-1B cap in fiscal year 2026, USCIS counted about 339,000 eligible unique beneficiaries and selected 118,660 of them in the initial selection. (USCIS)
- Rules keep moving. In 2026 alone, Germany raised its EU Blue Card salary thresholds (Make it in Germany), Sweden moved to a 90%-of-median salary requirement (Migrationsverket), Malaysia roughly doubled its Employment Pass salary minimums (ESD Malaysia), and Singapore announced higher Employment Pass salaries from 2027 (MOM). In the US, the $100,000 H-1B payment introduced in 2025 was blocked by the courts in 2026 while the government appeals (USCIS).
So I wanted a single view: where are the jobs, and where is the door actually open?
The findings
The sweet spot (many jobs, easier visa): Amsterdam, Paris, Tokyo, Seoul. All four combine strong tech ecosystems with a clear, employer-sponsored route.
- Amsterdam: the Netherlands’ highly skilled migrant permit, through an IND-recognised employer.
- Paris: France’s “Talent” residence card.
- Tokyo: Japan’s engineer visa and its points-based highly skilled professional track.
- Seoul: Korea’s E-7 professional visa.
None of them uses a lottery.
Close behind: Singapore, Tel Aviv, Dublin, Hong Kong.
- Singapore and Tel Aviv score higher on jobs than any city in the top group, but their visas are a bit harder. Singapore has a salary bar plus a points test. Israel has a high minimum salary for foreign experts.
- Dublin and Hong Kong are among the easiest visas on the chart for a solid job market. Ireland has its Critical Skills permit. Hong Kong’s Top Talent Pass doesn’t even require a job offer.
- Berlin, Toronto-Waterloo and Bengaluru sit just behind.
The US: the most jobs, the hardest visa. Silicon Valley, New York, Boston and Seattle top the jobs axis. They also sit at the bottom of the visa axis. The H-1B is capped and allocated by lottery, now weighted by wage level. On top of that, policy has been unstable: a $100,000 fee was announced, then blocked by courts, and a separate fee has been proposed.
Other patterns:
- London has a deep job market. But the UK Skilled Worker route needs a licensed sponsor and a £41,700 minimum salary, which puts it just outside the sweet spot.
- Zurich and China’s hubs (Beijing, Shanghai, Shenzhen, Hangzhou) are hard. Switzerland has a fixed annual quota for non-EU workers. China uses a points-based permit system with rising salary thresholds.
- Many smaller hubs are easy to enter but have fewer jobs. Examples are Tallinn, Vilnius, Helsinki, Dubai, Kuala Lumpur and Auckland. They’re worth a look if you already have an offer or work remotely.
Methodology
Tech jobs score (1-10). This is based mainly on the Startup Genome Global Startup Ecosystem Report 2025 ranking. I adjusted it with my judgment of each hub’s size and pay level. Hubs outside that ranking were scored on general market size only.
Visa difficulty score (1-10). Each hub starts at 1 and adds points:
- +3 for a capped lottery (US H-1B)
- +2 for a hard national quota, or +1 for a soft or very large quota or an overall cap on temporary workers
- +1 if employer sponsorship is required
- +1 for a labour-market test or local-hire/understudy requirement
- +1 for a salary or points threshold that is high relative to local tech pay
- +1 if typical processing takes over 3 months (+2 if over 6 months or tied to an annual cycle)
- +1 each for: a language barrier in most tech jobs, recent tightening, policy instability or high fees or security concerns, heavy bureaucracy
Scores max out at 10. In practice they range from 2 to 8. The chart’s quadrant line sits at 4.5 on visa difficulty and 5.5 on jobs.
Verification. On 13 October 2026, I checked the main skilled-worker route in each of the 43 countries behind the 64 hubs against official immigration pages.
- 37 countries: I opened and read official pages, fully for 28 and partially for 9.
- Vietnam: checked against the full text of the relevant decree on a legal database.
- 5 countries: the official sites could not be fetched (blocked, bot checks or dead links). These are India, Israel, Australia, Finland and Colombia, and their scores rely on secondary sources.
A few inputs are also flagged as secondary-only. Examples include Korea’s E-7 salary floor, Japan’s processing times and Poland’s Blue Card salary. The full per-country data (exact URLs read and inputs that remain unverified) is available on request: DM me or email explore@juliensalinas.com.
Assumptions:
- The person is a skilled tech worker from outside the EU, with a job offer.
- Nationality matters a lot. EU citizens move freely within the EU, and bilateral deals exist, so your personal result may differ.
- Points were nudged slightly apart on the chart when scores tie.
Caveats
- These are editorial scores, not measurements. The rubric makes my judgment explicit and consistent, but it is still judgment.
- Rules change fast. Several changed during 2026, and the US fee situation could flip again after appeal. Check the official page before you act.
- A visa route existing doesn’t mean you’ll get it. Approval depends on your profile, your employer and the specific role.
- The jobs score leans on startup ecosystems. It under-weights places with large corporate or outsourcing tech employment.
- Cost of living, salaries after tax, language and quality of life aren’t on this chart. They matter as much as the two axes.
If you spot an error or a rule that changed, tell me and I’ll update the chart.
Julien Salinas · @juliensalinas · explore@juliensalinas.com