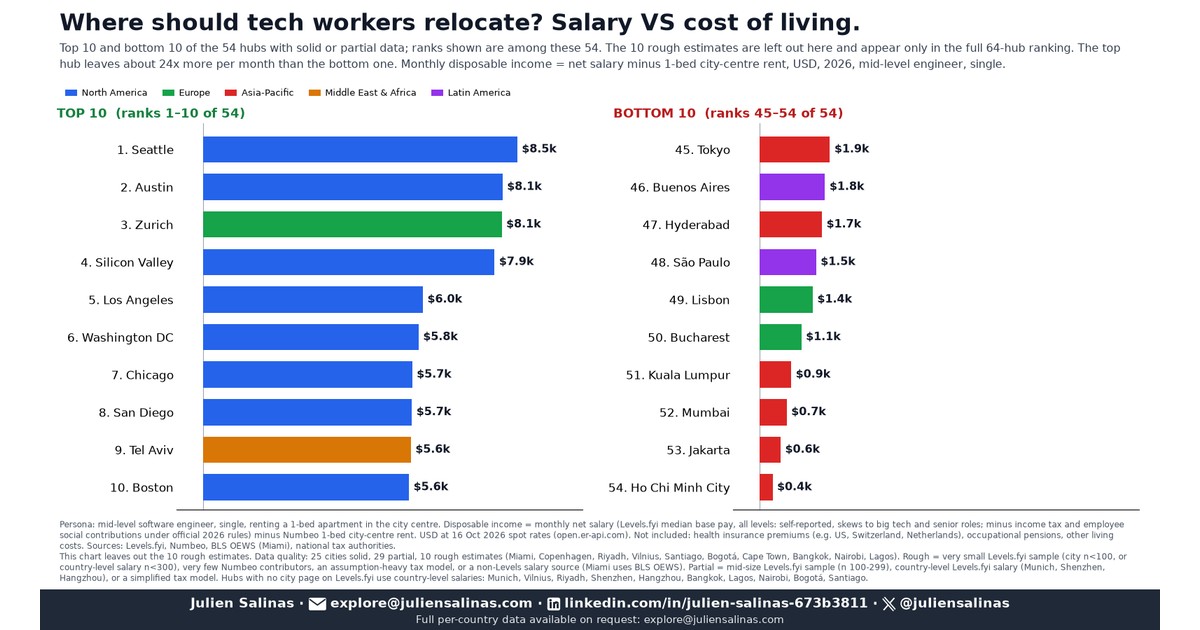
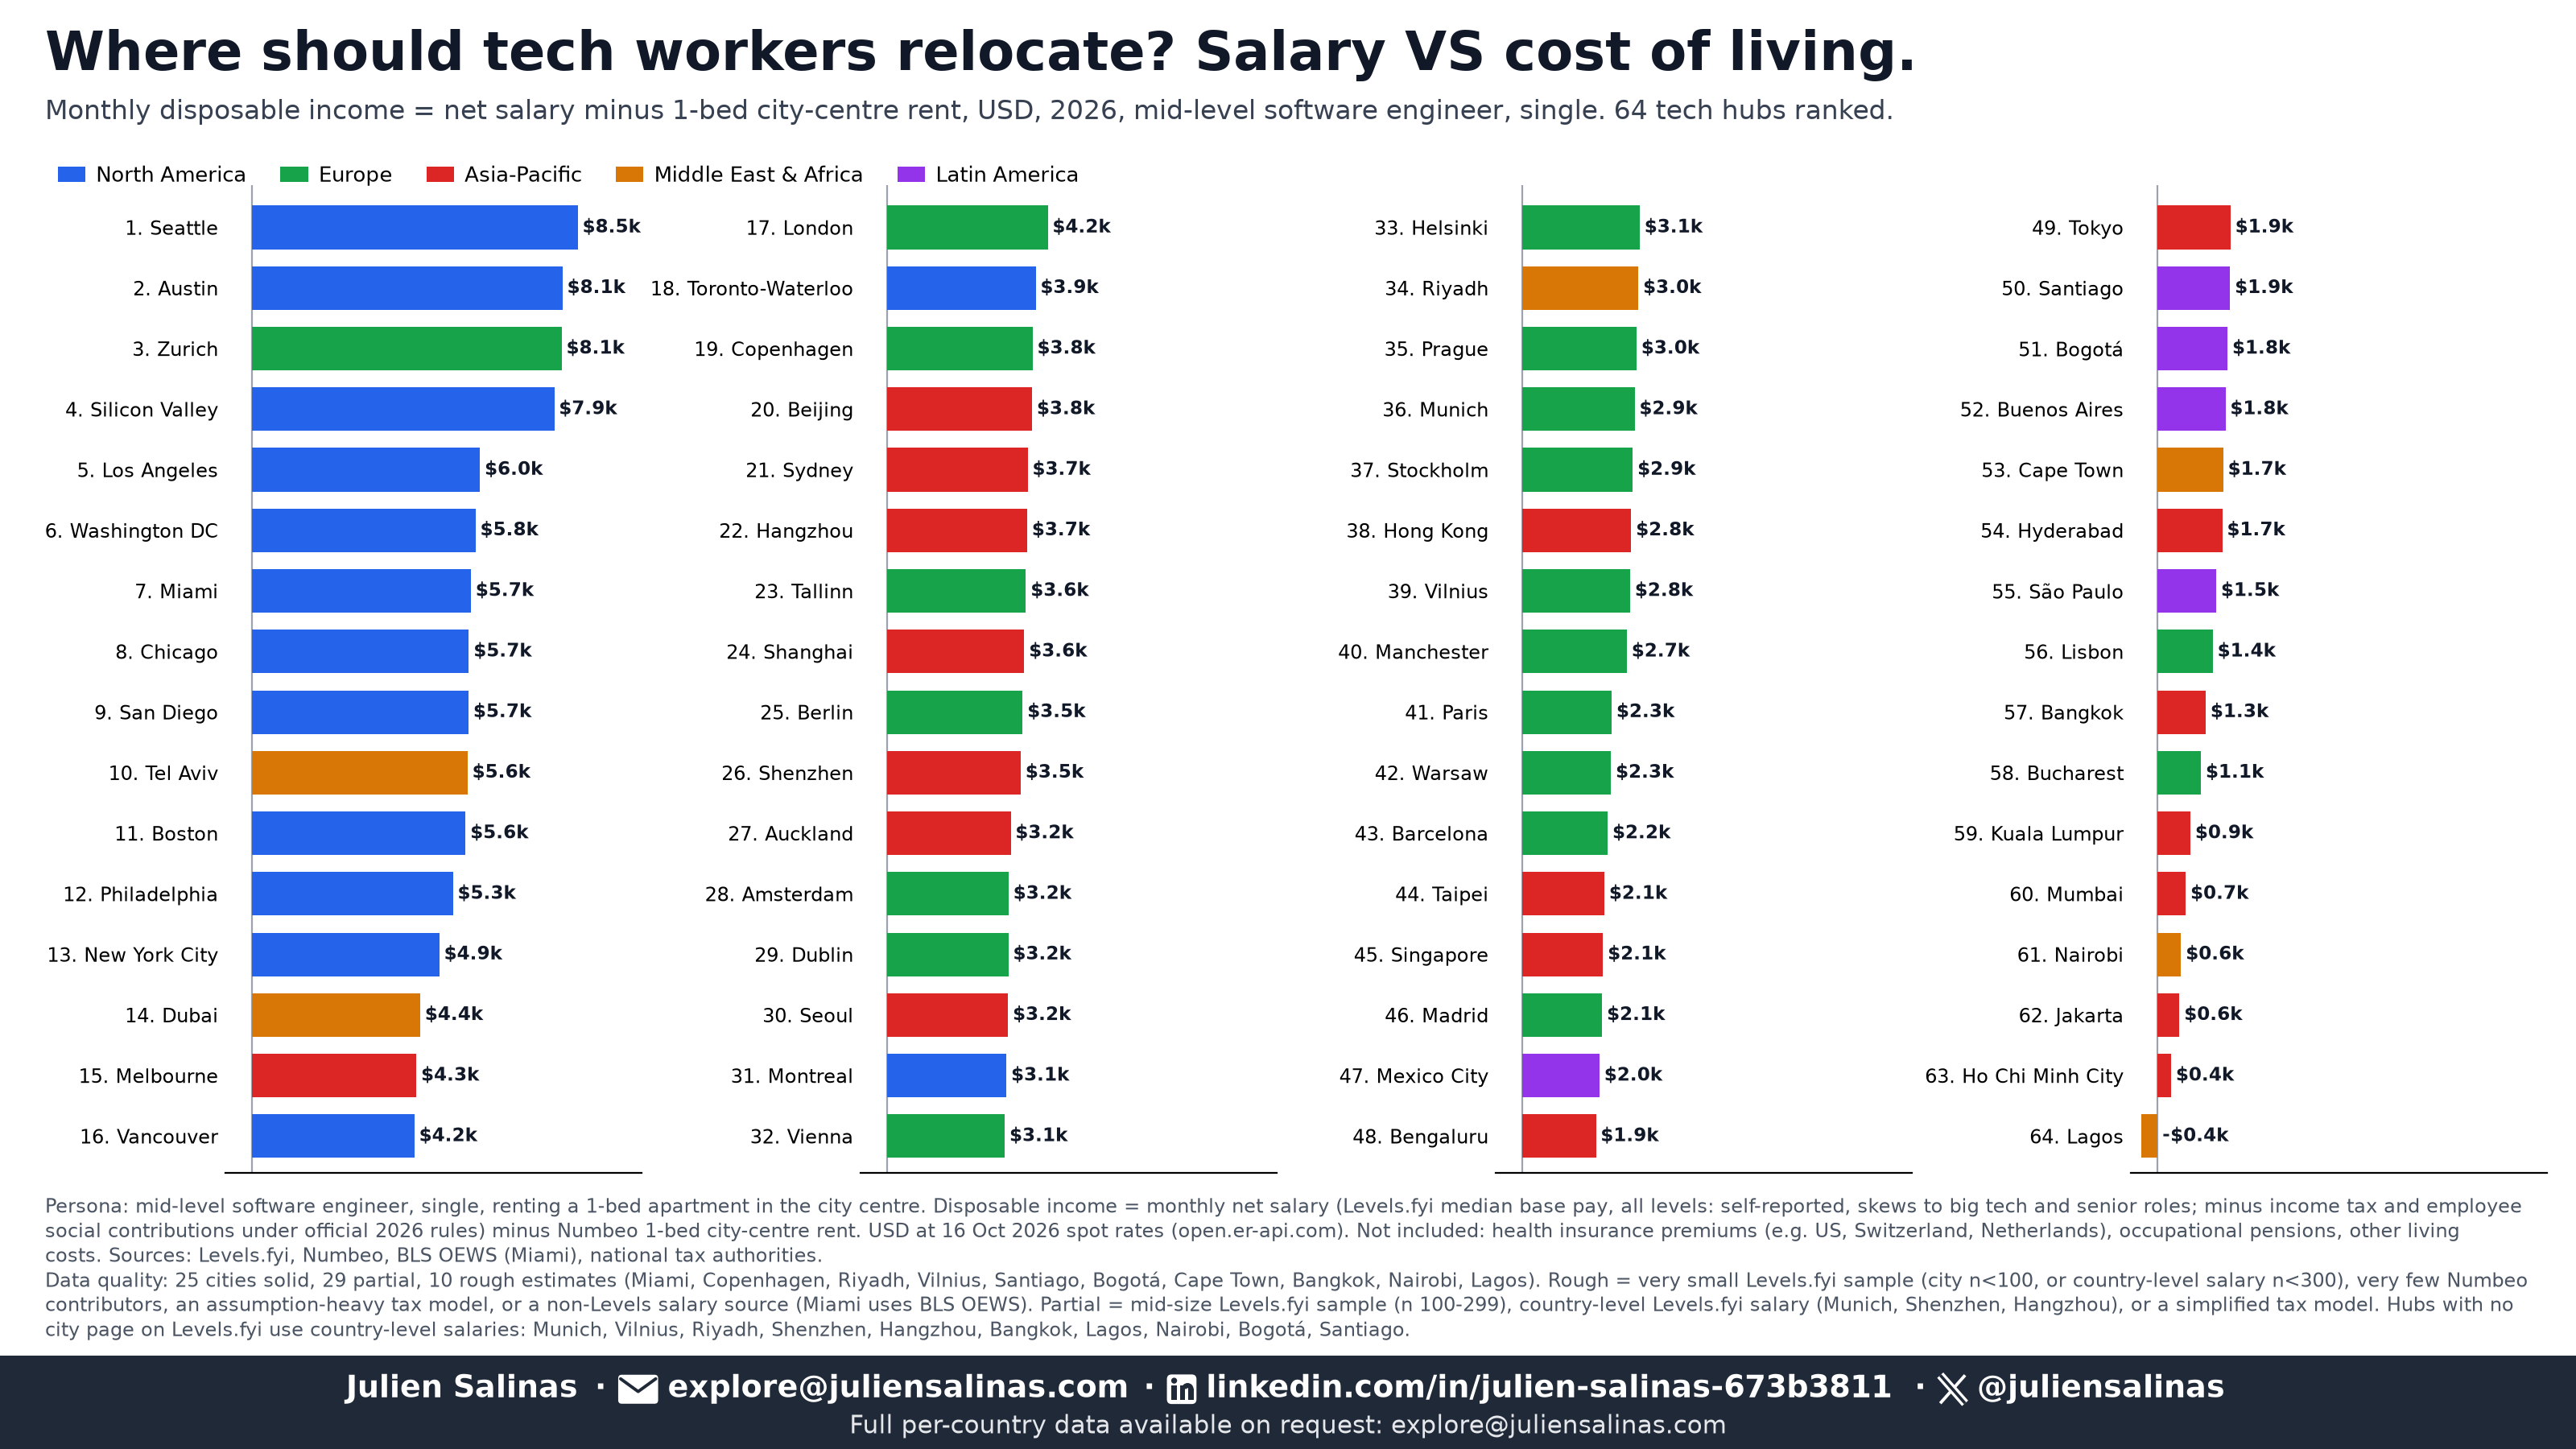

A software engineer on a $200,000 salary in Silicon Valley keeps less each month than one on $160,000 in Austin. Once you subtract income tax and rent, $7,912 a month in the Valley versus $8,128 in Austin. That is why I stopped comparing salaries and started comparing what is left at the end of the month, for 64 tech hubs.
Why salary alone is misleading
Two things sit between a gross salary and your bank account: what the state takes (income tax and social contributions) and what your landlord takes. Both vary enormously from one hub to the next. In the data below, the share of gross pay going to tax and social contributions ranges from 0% (Dubai, Riyadh) to 41.5% (Bucharest). The rent for a one-bedroom apartment in the city centre ranges from $230 a month in Hyderabad to $4,411 in New York.
This is the second half of a pair. In my previous post I asked “can you actually get a work visa there?”. This one asks “is it worth going?”.
How I measured it
I used one persona everywhere: a mid-level software engineer, single, renting a one-bedroom apartment near the city centre.
- Gross salary: the median base salary for Software Engineers on Levels.fyi, accessed on 16 October 2026.
- Net salary: gross salary minus income tax and employee social contributions for a single person, computed with each country’s official 2026 rules.
- Rent: the average one-bedroom city-centre rent on Numbeo.
- Currency: everything converted to USD at the 16 October 2026 spot rate.
- Result: monthly disposable income = net salary / 12 minus rent.
I left out groceries, transport and everything else. Rent is the one cost I could compare consistently across all 64 hubs. This is not a full cost-of-living index.
What I found
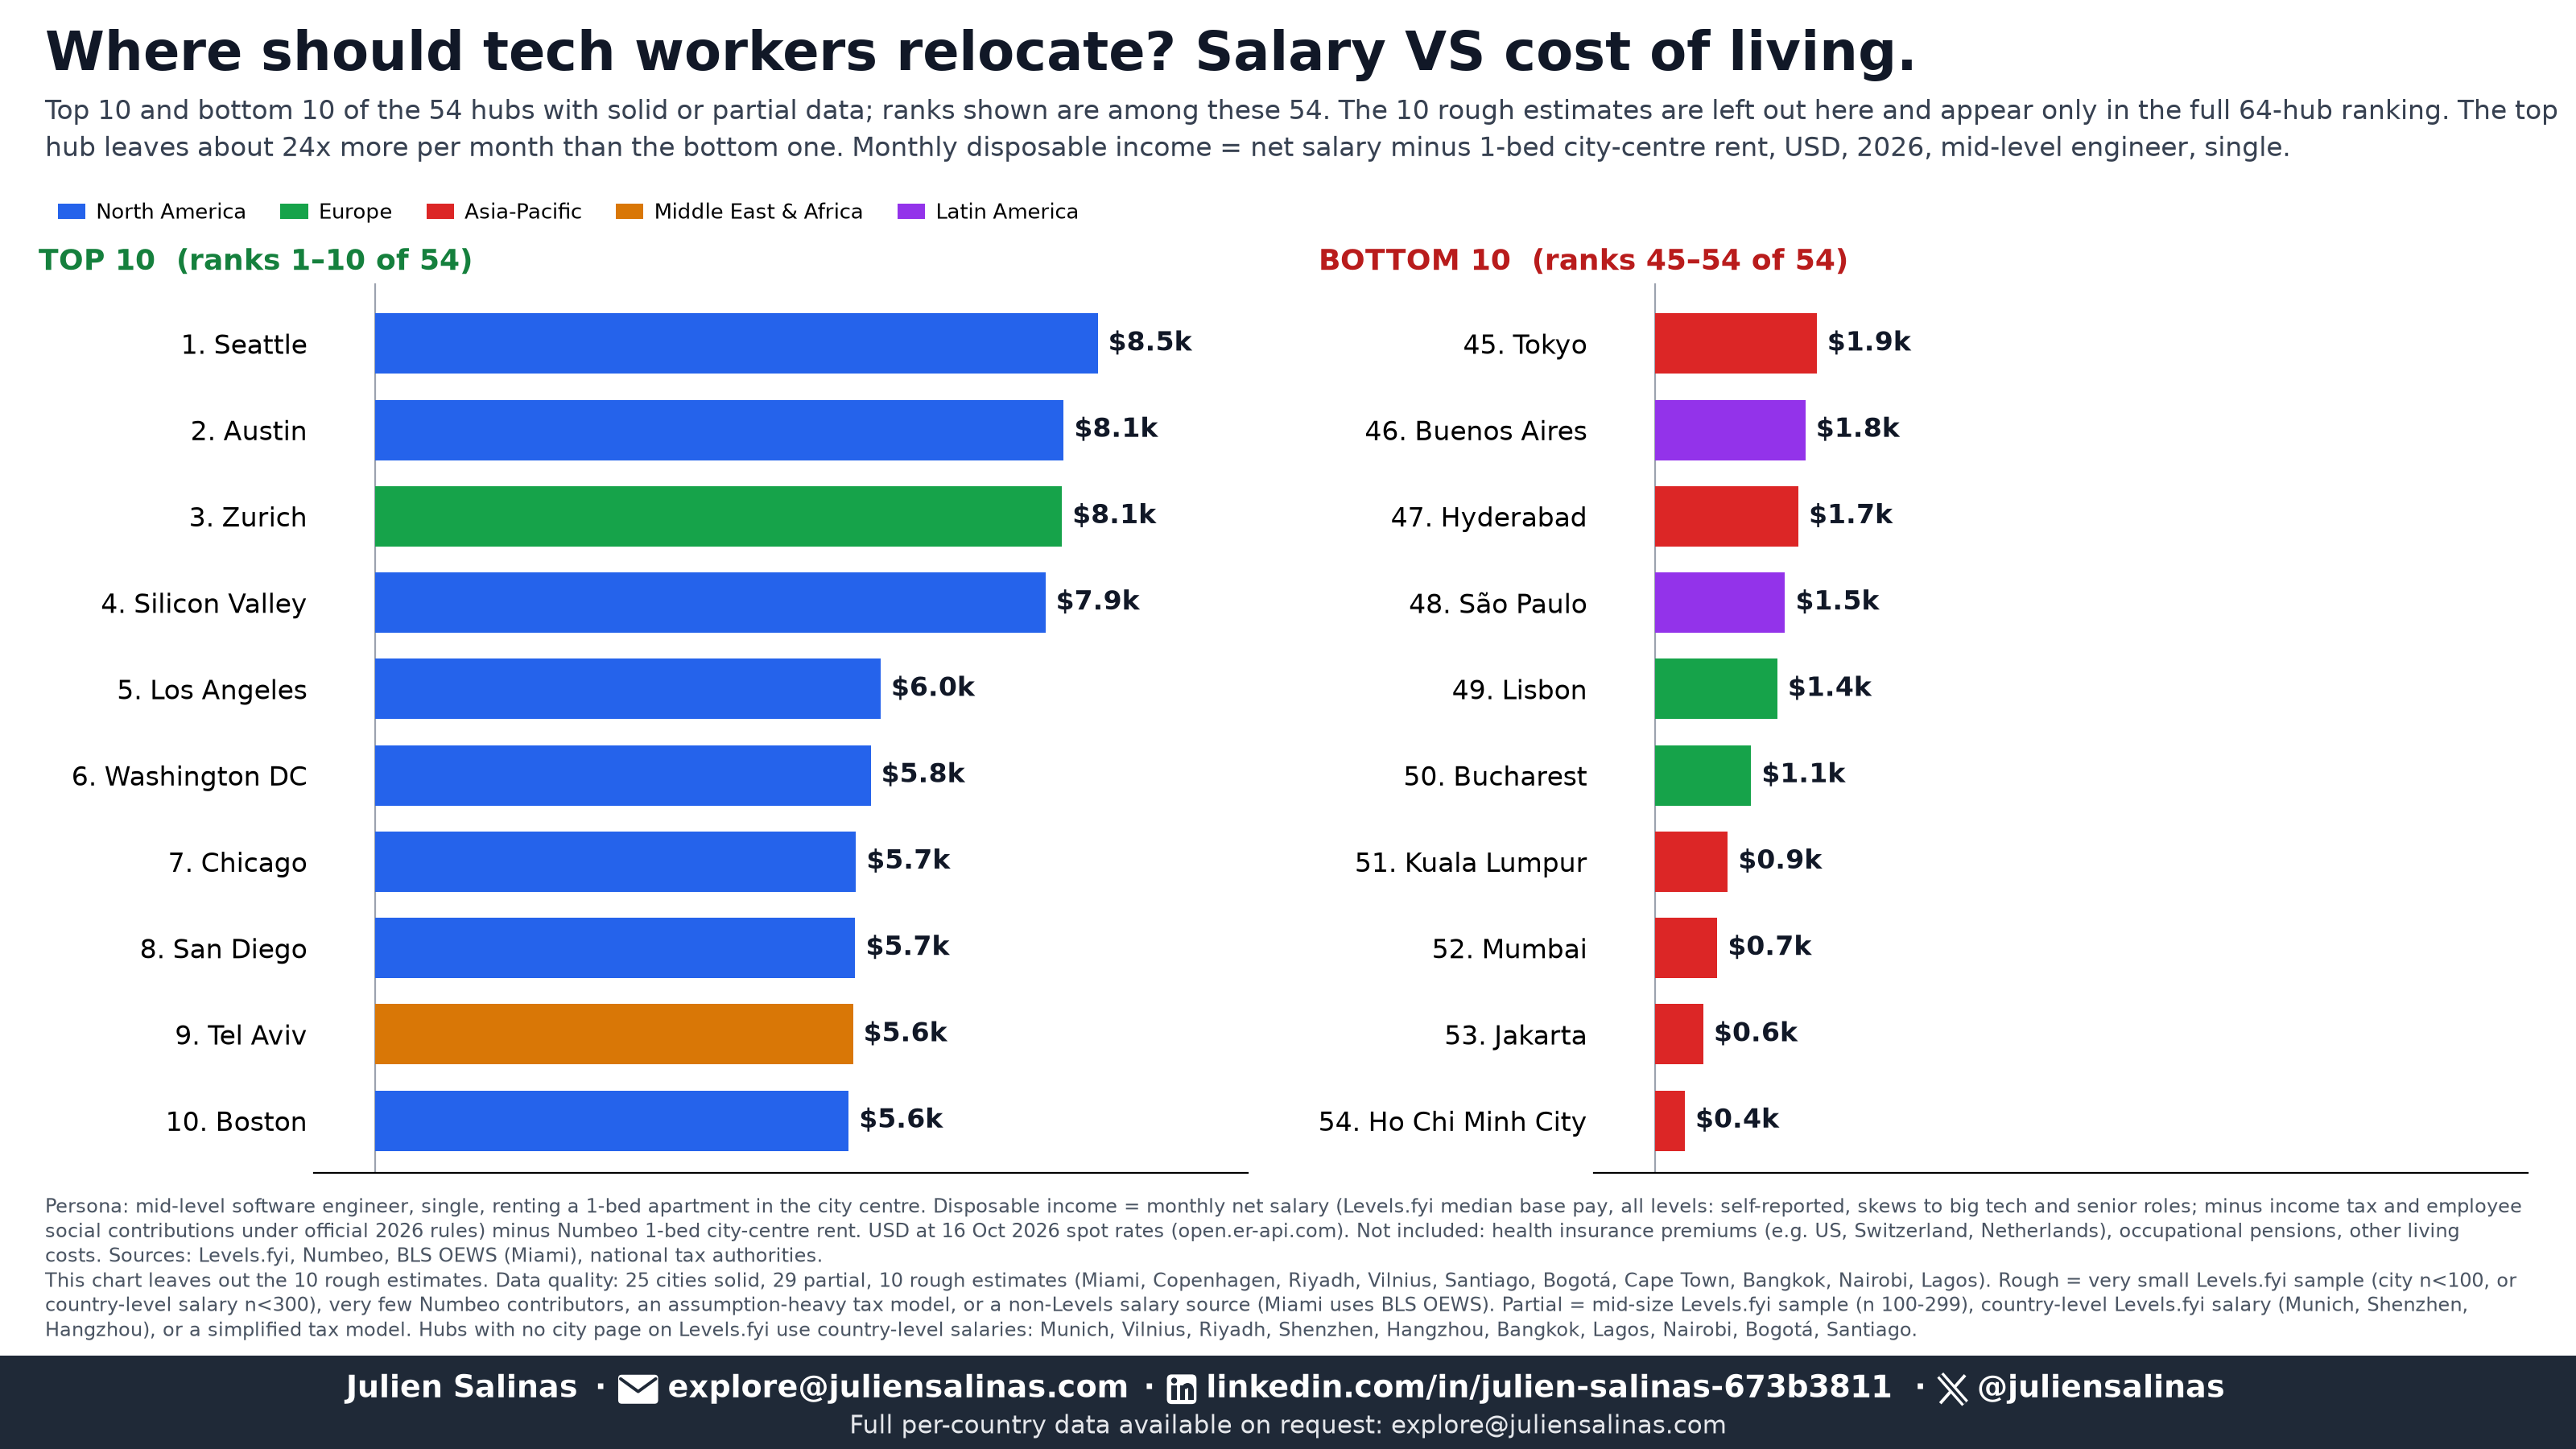
Seattle, Austin, Zurich and Silicon Valley lead.
- Seattle: $8,529 a month
- Austin: $8,128
- Zurich: $8,107
- Silicon Valley: $7,912
Twelve hubs leave more than $5,000 a month. Ten are in the US, plus Zurich and Tel Aviv ($5,641). All 11 US hubs sit in the top 13.
Silicon Valley has the highest salary, but is only fourth. The median base pay is $200,000, the highest of the 64 hubs. But 34% of it goes to tax and social contributions, against 26.8% in Seattle and 24.6% in Austin. Rent in San Jose is $3,086, against $2,454 in Seattle and $1,924 in Austin. Silicon Valley’s net monthly salary ($10,998) is almost the same as Seattle’s ($10,983). The rent difference is what pushes it down.
New York is a rent story. A $170,000 salary leaves $9,312 a month after tax, but rent ($4,411) is the highest on the chart. You keep $4,902, 13th.
Dubai vs. London. Dubai charges no income tax, so an $81,699 salary is all net. After rent you keep $4,401 a month. London pays $121,799 gross, but you keep $4,202. Close enough that I would call it a tie, and Dubai’s figure is graded “partial” (see limitations).
Paris vs. London. Paris leaves $2,336 a month, London $4,202, about 1.8 times more. The difference comes from pay, not rent: the London median is $121,799 gross against $68,256 in Paris, while London rent is $2,851 against $1,556.
China vs. Berlin. Beijing ($3,792), Hangzhou ($3,663) and Shanghai ($3,587) all beat Berlin ($3,544). Shenzhen ($3,494) is just below. Berlin pays more gross ($101,005 against $80,787 in Beijing), but 40.3% goes to tax and social contributions and rent is higher ($1,481 against $937 in Beijing).
Singapore, with a note. Singapore’s gross salary is $78,747, but you keep only $2,109 a month, roughly level with Madrid ($2,087). Rent is $2,924, and I deducted the 20% employee CPF contribution, which applies to citizens and permanent residents. An expat on an Employment Pass pays no CPF, so for them the figure would be higher.
The earlier “sweet spot” hubs. Amsterdam ($3,175), Seoul ($3,162), Paris ($2,336) and Tokyo ($1,909) offered the best jobs-versus-visa balance in my previous post. Here they land between $1.9k and $3.2k.
The bottom of the list. Ho Chi Minh City leaves $353 a month, Jakarta $571 and Mumbai $736. Seattle leaves about 24 times more than Ho Chi Minh City, and about 2.8 times the median hub (about $3.1k). One caution: this is in dollars, so it shows how far a salary goes if you spend in dollars, not how well someone lives locally.
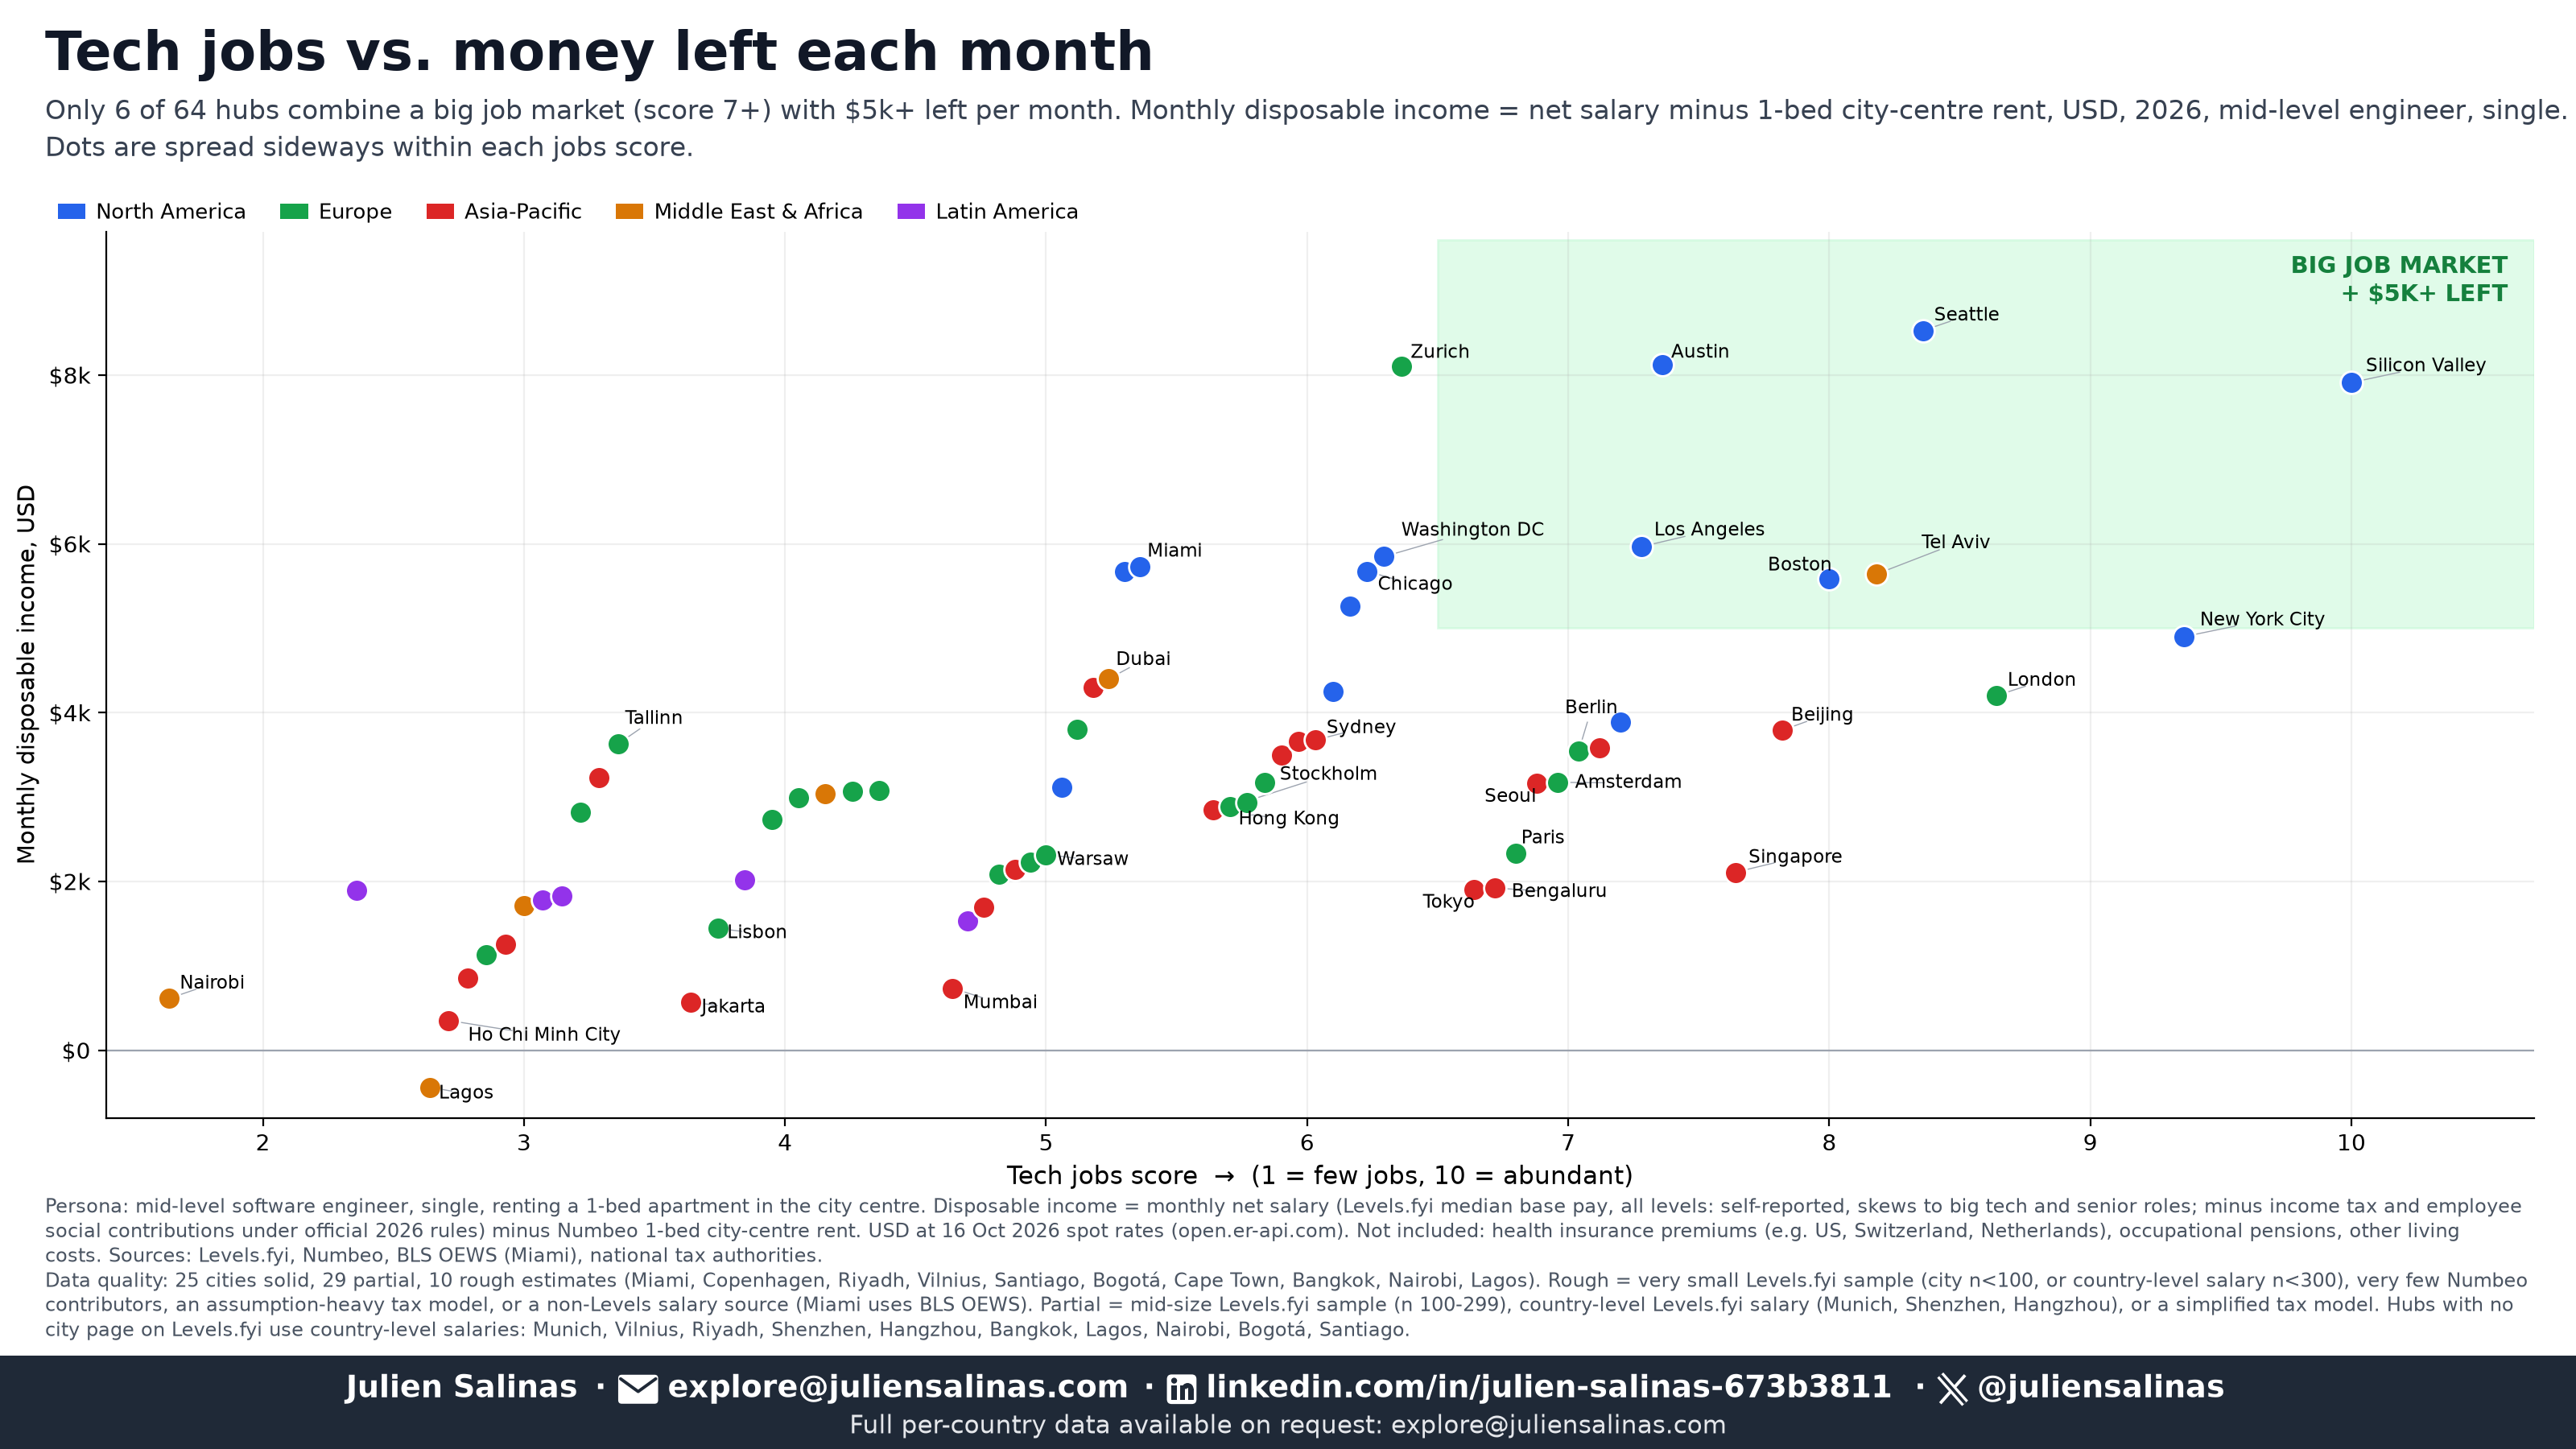
Jobs vs. leftover money. Only six hubs combine a tech jobs score of 7+ with more than $5,000 a month: Seattle, Silicon Valley, Austin, Los Angeles, Boston and Tel Aviv. Apart from Zurich (visa difficulty 6) and Tel Aviv (4), every hub above $5,000 is a US hub with a visa difficulty score of 8. The money is where the visa is hardest.
Limitations
- Levels.fyi medians cover all levels. They are self-reported and lean toward big tech and senior roles. I could not isolate “mid-level”. In emerging markets they probably overstate what a typical local engineer earns.
- Health premiums and occupational pensions are excluded everywhere. I included mandatory government social contributions and statutory provident funds, but not private health insurance (mandatory in the Netherlands and Switzerland, employer-provided in the US) or employer and occupational pensions. This probably flatters Zurich and the US most.
- Data quality varies. Of the 64 hubs, 25 are solid, 29 partial and 10 rough. “Solid” means a large Levels.fyi sample, enough Numbeo contributors and a complete tax model. “Partial” means one of those is weaker, such as a country-level salary used for a city or a simplified tax model. The 10 rough estimates are Miami, Copenhagen, Riyadh, Vilnius, Santiago, Bogotá, Cape Town, Bangkok, Nairobi and Lagos. Treat their rank as indicative only. Lagos comes out negative (-$439 a month) on a very small salary sample.
- Miami uses a different source. Levels.fyi has no Miami page, so I used the US Bureau of Labor Statistics median for software developers in the Miami metro area ($132,650). It covers all employers and is not directly comparable.
- Spot rates. I converted at one day’s exchange rate, so a currency move of a few percent can reorder close hubs. Hangzhou and Shenzhen use the China-wide Levels.fyi median.
- Rent is crowd-sourced. Numbeo’s number of contributors differs by city.
The ranking is therefore reliable for large gaps (Seattle vs. Paris, or London vs. Mumbai) and not for small ones (Dubai vs. London, Berlin vs. Shenzhen).
Sources
- Salaries: Levels.fyi, Software Engineer base salary, median, accessed 16 October 2026. Miami: US Bureau of Labor Statistics, Occupational Employment and Wage Statistics, May 2025, software developers, Miami metro area.
- Rent: Numbeo, one-bedroom apartment in city centre, data updated mid-October 2026.
- Exchange rates: ExchangeRate-API (open.er-api.com), 16 October 2026.
- Taxes and social contributions (2026 rules): official authorities, for example the IRS and SSA (US), CRA (Canada), GOV.UK (UK), §32a EStG (Germany), ESTV and the canton of Zurich (Switzerland), Belastingdienst (Netherlands), IRAS and the CPF Board (Singapore), and the national authority of each other country.
The full per-country data, with the exact sources, assumptions and tax parameters for each hub, is available on request: email explore@juliensalinas.com.
If you spot an error, or a rule that changed, tell me and I will update the chart.
Julien Salinas · @juliensalinas · explore@juliensalinas.com · linkedin.com/in/julien-salinas-673b3811